|
AnyExpress an integrated toolkit for cross-platform gene expression data |
 |
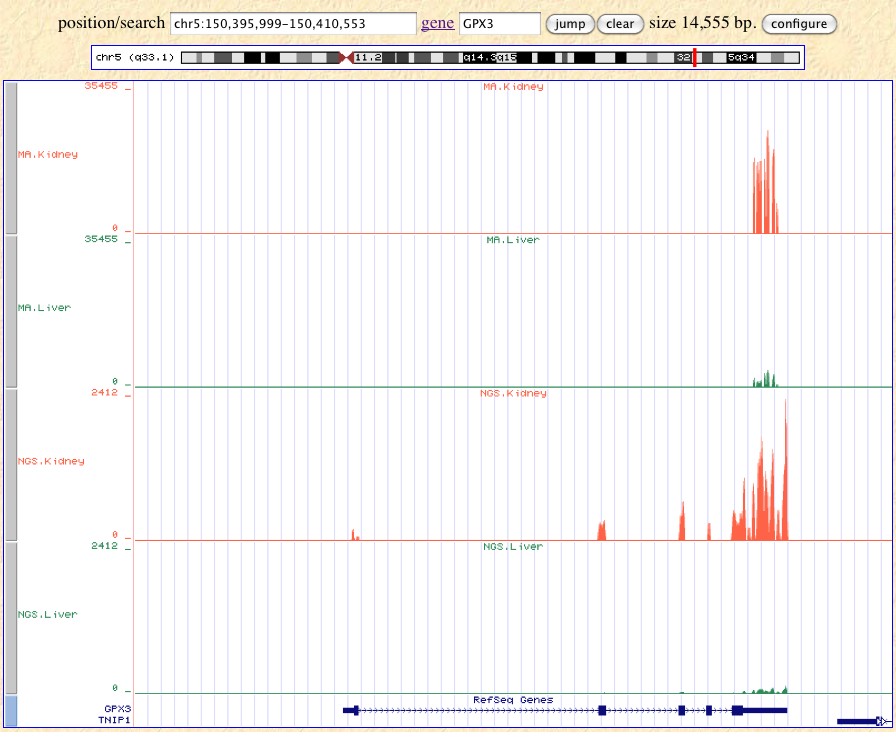
Figure: a coverage plot generated from the ‘AnyExpress Plot’ module for the gene GPX3, which functions in the detoxification of hydrogen peroxide. This gene is known to have tissue-specific expression, highest in kidney and low in liver [Ottaviano et al., 2009]. The top two tracks represent kidney (red) and liver (green) samples measured by Affymetrix U133PLUS2 microarray. The bottom two tracks represent kidney (red) and liver (green) measured by Illumina GA NGS [Marioni et al., 2008]. Differential expression between two tissues, kidney (red) vs. liver (green), is well reproduced across these two platforms.
Recent news
1.0 release - 8/20/10
- The very first version got released and is under beta-testing.